Ø Given the impacts of business as usual emissions we need to act now. What is the maximum increase in temperature the planet can tollerate?
The answer to this question has, necessarily, to be somewhat arbitrary, any change in climate from that we are currently experiencing will negatively impacts ecosystems that are well adapted to our current climate. The absolute level of change over the coming centuries will probably be of salient importance for global ecology, due to the limits on adaptation mentioned earlier. The rate of change is however still an important factor. For humans, the absolute level of change will have greatest impact on the cultures of various regions of the world and on levels of disease but in many ways, particularly economically the rate of change is likely to be the biggest problem, humans can adapt well to many different ways of living but time for this adaptation is required.
The impact of various degrees of warming, on ecosystems are shown in the tables below.
 Fig 31: Ecosystem Impacts (I and II)
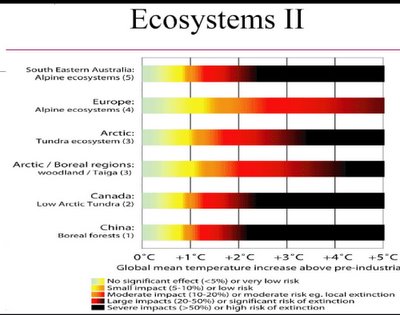
From these tables (fig.31) it is clear that at around one degree of warming there is a transition in many ecosystems from small to moderate levels of risk or impact. Moving to two degrees we find that we are close to the boundary between, large impacts (20-50%) or significant risk, and severe impacts (>50%) or high risk of extinction. This is the level of change that the Europeans have decided to use as their definition of avoiding dangerous climate change! The Europeans seem to be attempting to lead the world on climate change mitigation, this is indeed the partially sighted leading the blind!
The European council however decided on 14 October 2004 that:
“the maximum global temperature increase of 2oC over pre-industrial levels should be considered as an overall long-term objective to guide global efforts to reduce climate change risks “
There is a recognition however that:
“2oc would already imply significant impacts on ecosystems and water resources”
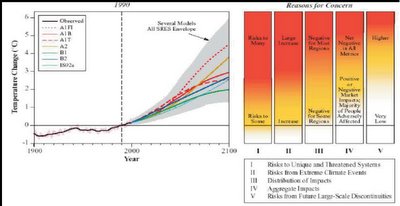
Fig 32: The Impacts of Climate Change
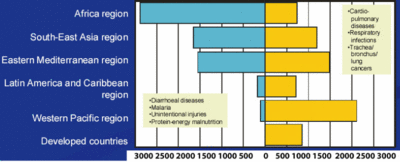
The table above highlights the range of impacts likely due to climate change and shows the likelihood of each posing problems. Looking at column V (fig.32) it can be seen that in the IPCC’s TAR the risk of abrupt climate change was considered to be relatively low at a warming of up to three degrees. However professor Schneider of Stanford university who is currently in the process of helping to produce the fourth assessment report makes into clear that there is a significant risk of so-called “large-scale discontinuities” and that we ought to use the precautionary principle and do our best to avoid pushing the system harder, or further that we have to. The diagram bellow shows the health risks based on the level of climate change by 2080.

Fig 33: Humanatarian/Health problems associated with Climate Change.
The increase in number of people at risk from water shortages increases rapidly between 1.5 and 2.5 degrees. We cannot allow water shortages to be a significant risk for more than 3 Billion People! We again see the intimate link between climate change mitigation and development, we cannot reduce poverty unless the problem of climate change is addressed (fig.33).
Ø What concentration of carbon dioxide in the atmosphere would lead to warming no greater than two degrees Celsius?
A conference of the world top climate scientists was convened at the world-renowned Hadley Center for Climate Change in Exeter UK to answer this question. Based on our current knowledge a peak at 475ppm and stabilization thereafter at 400ppm is generally accepted as the maximum permissible atmospheric carbon dioxide levels to make a warming of more that 2oC “unlikely” where unlikely is defined as less than 20% (fig.34). This contrasts strongly with the European Commission view that limiting global emissions of carbon dioxide to 550ppm will deliver the required constraints on climate change. In fact :
“Current research cannot exclude very high levels of warming e.g.> 4.5oC for stabliisation at 550ppm equivalence.”
Fig 34: Probability of less than two degrees warming based on different emision scenarios.
The above diagrams show that at a stabilisation level of 550ppm there is actually a 75% chance that warming of greater than 2 degrees Celsius will occur. For the chart on the right P475-S400 it can be shown that there is only a 20% chance of over run if we peak carbon dioxide concentrations in the atmosphere at 475ppm and then reduce our emissions further to allow reduction to a stable 400ppm level. The diagram below shows the predictions made by various models for different levels of stabilization.
Fig 35:Correlation between carbon dioxide and warming based on current models.
Ø Limiting warming to this degree would allow for the emission of how much carbon dioxide by humans per year?
Models suggest that by reducing global emissions to 50% of 1990 levels by 2050 we can limit the carbon dioxide in the atmosphere to 450ppm. Recent research by The Hadley Center and the Center for Ecology and Hydrology has been presented recently; this suggests we have a lower quota than previously thought. Previous scenarios are likely too be optimistic due to underestimating positive carbon feedbacks from the earth system(fig.36). Positive feedbacks act to increase the release of carbon dioxide into the atmosphere from natural sources i.e. release of carbon from rainforests due to increased degradation or more forest fires in temperate woodland. Another example of positive feedback is the release of methane stored in the permafrost of Siberia and in the cold deep seas of the arctic regions. It is now likely that a reduction of >70% in anthropogenic carbon emissions will be required by 2050 to limit carbon dioxide in the atmosphere to 450ppm.
These graphs show the difference in emissions reductions required to obtain Europe’s current, and insufficient, guideline target of 550ppm. The effect of carbon feedbacks is to decrease our global emissions quota by 20-30%.
Fig 36:The impact of increased carbon feedbacks on emmisions stabilisation.
Ø The principle of equity suggests that everyone on the planet has an equal right to carrying out activities that release carbon. How much carbon per person per year does this amount to?
This depends on the global population and our global allowance. A 70% gross reduction on 1990 levels 7GtC a-1 equates to 2.1GtC a-1 by 2050. Given the estimated population in 2050 of 9 billion people this equates to 0.23tC per person. As carbon has a relative atomic mass (r.a.m) of 12 and an oxygen atom has r.a.m of 18 0.23tC is equivalent amount of CO2 is = ((18+18+12)/12)*0.23tC .
This works out as 0.92 tCO2 per person per year.
------------------------------------------------------------------------------------------------
------------------------------------------------------------------------------------------------
All four parts of this report can be downloaded in pdf format from here. The 4 parts are:
1. The basic science of Climate Change.
2. The effects of Climate Change already being observed.
3. The effects of Climate Change predicted for the future.
4. The emmisions reductions required to avoid the worst effects of climate change.
main page
------------------------------------------------------------------------------------------------
------------------------------------------------------------------------------------------------
Ø Figures
1. Greenhouse effect basics, http://earth.unh.edu/esci402/docs/Greenhouse%20Effect.jpg
2. Intergovernmental Panel on Climate Change Third Assessment Report
3. Vital Climate Graphics, http://www.grida.no/climate/vital/23.htm
4-5. Richard.B.Alley, 2000, The Two Mile Time Machine, Princeton.
6-8. Arctic Climate Impact Assessment, 2004, http://www.acia.uaf.edu/
9.http://cas.bellarmine.edu/tietjen/Environmental/Drunk%20Trees.gif
10. World View of Global Warming. http://www.worldviewofglobalwarming.org/pages/glaciers.html
11+12. www.marklynas.org
13. Pounds,J.A., Puschendorf,R. Nature 427, 107-109 (2004)
14. www.marklynas.org
15-16. Campbell-Lendrum,D.H., Kovats,R.S., McMichael.A.J., Corvalan.C., Menne.B., Pruss-Usstun.A; “The global burden of disease due to climate change: quantifying the benefits of stabilization for human health”, www.stabilisation2005.com/
17+18: Arctic Climate Impact Assessment, 2004, http://www.acia.uaf.edu/
19. University of Middlesex
20. Pew Center on Global Climate Change, February 2000, “Sea level rise and Global Climate Change: A review of impacts on U.S. coasts”.
21. Arctic Climate Impact Assessment, 2004, http://www.acia.uaf.edu/
22-24. www.marklynas.org
25.Pimm,S.L., Raven.P., Nature, 403, 843-845 (2000)
26. Hare.B., February 2005, “Global mean temperature and impacts on ecosystems, food production, water and socio-economic systems” www.stabilisation2005.com/
27+28. Campbell-Lendrum,D.H., Kovats,R.S., McMichael.A.J., Corvalan.C., Menne.B., Pruss-Usstun.A; February 2005, “The global burden of disease due to climate change: qauntifying the benefits of stabilization for human health”, www.stabilisation2005.com/
29. Schnider.S.H., Februrary 2005, “Overview of ‘Dangerous’ Climate Change”, www.stabilisation2005.com/
30+31. Hare.B., February 2005, “Global mean temperature and impacts on ecosystems, food production, water and socio-economic systems” www.stabilisation2005.com/
32+33. Meinshausen.M., Februrary 2005, “On the risk of overshooting 2 degrees Celsius”, www.stabilisation2005.com/
34+35. Jones.C., Cox.P., Huntingfor.C., February 2005, “Impact of climate-carbon cycle feedbacks on emissions scenarios to achieve stabilization” www.stabilisation2005.com/
Ø References:
Books
Sharon.L.Spray and Karen.L.McGlothlin, 2002, Global Climate Change, Rowman and Littlefield Publishers.
Richard.B.Alley, 2000, The Two Mile Time Machine, Princeton.
Mayer Hillman, 2004, How We Can Save the Planet, Penguin Books.
Reports/Articles/Papers/Presentations

Labels: science
 Home
Home


 del.icio.us

 Digg This!


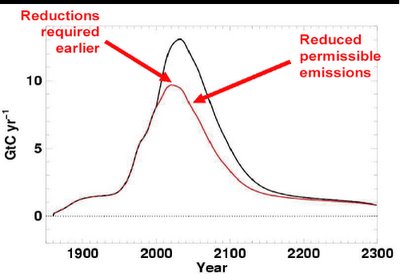


 Fig 28


